As we head towards the end of 2025, U.S. stocks have once again turned in strong
performance, especially after the large drawdown experienced during the Trump
Administration reciprocal tariff announcements in early April (Liberation Day Sell-Off).
In particular, the so-called Mag7 stocks comprising of megacap technology growth
companies have led the broader market (Figure 1), thanks largely due to the
exponential growth outlook for the buildout of artificial intelligence data processing. The
Mag7 now comprise an increasing concentration within the market, resulting in narrow
breadth that has left the rest of the market gasping in their wake.
Figure 1 – The Mag7 (BM7P) Lead All Major U.S. Market Indices
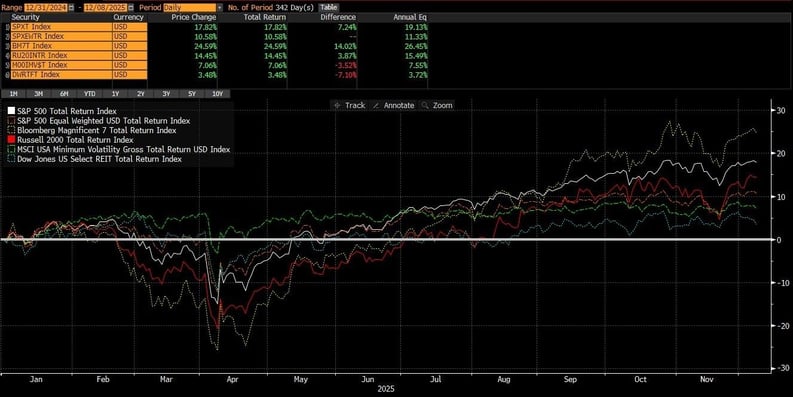
Source: Bloomberg YTD Total Returns Through 12/8/2025
This outperformance is not entirely without a fundamental explanation as the Mag7 and some of the largest companies by cap-weighting in the S&P 500 have enjoyed greater profitability (return on equity ) versus their smaller peers, even as this profitability gap has produced one of the widest valuation (forward price/earnings) gaps across the market (Figure 2).
Figure 2 – The Mag7 (BM7P) Is Afforded a Higher Valuation versus the Cap-Weighted S&P 500 (SPX) and the Equal-Weighted S&P 500 (SPW) Due to Higher 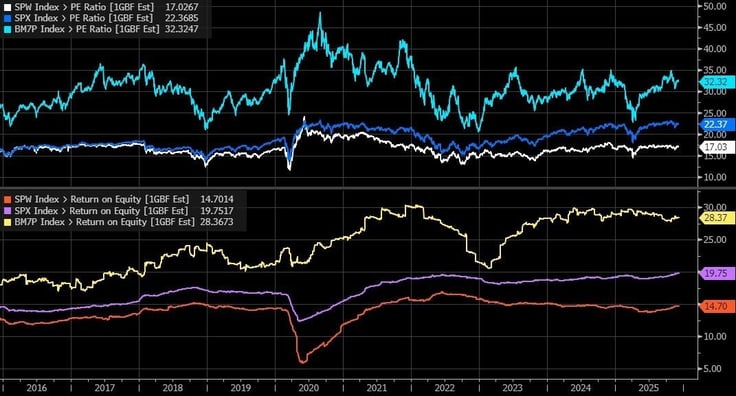
Source: Bloomberg 12-Month Estimated P/E and Return on Equity (ROE)
Left behind are not only the small and mid-cap stocks, but also defensive segments within the market, whether lower volatility stocks, high dividend paying stocks, or real estate investment trusts (REITs). Although defensive market segments had outperformed leading up to and during the Liberation Day sell-off, they have since lagged the more pro-cyclical segments of the market, as much of the threatened tariffs and trade barriers were either delayed or rolled back as part of new trade agreement frameworks. This has led to one of the widest valuation gaps between defensive factors versus the broader market, even though there is not a significant difference in expected profitability (Figure 3).
Figure 3 – The S&P 500 (SPX) Is Afforded a Higher Valuation Versus Minimum Volatility (M001MV$T) and High Dividend (MXUSAHDV) Even Though All Three Exhibit Similar Profitability Outlooks
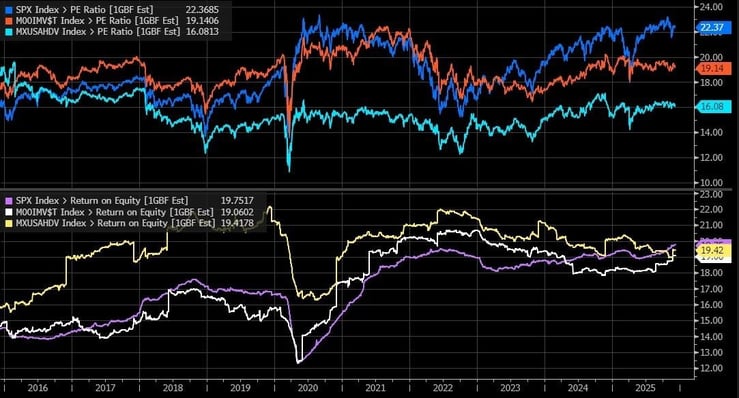
Source: Bloomberg 12-Month Estimated P/E and Return on Equity (ROE)
This was to be expected as the worst fears of the tariff impact on economic growth did not pan out, while consumer and business spending helped keep the U.S. economy afloat during the 2nd half. Not only are the defensive market segments expected to experience slower earnings growth versus the broader market, but they’ve also experienced downward revisions in their near-term growth outlook over the prospects of slowing revenue growth and tighter profit margins weighed down by higher input costs, stemming from higher tariffs making their way through the supply chain (Figure 4).
Even in the case of higher projected revenue growth for MSCI USA High Dividend (think industrial and energy infrastructure providers for the buildout of AI data centers), high dividend stocks suffer from lower earnings power since a large portion of excess earnings is paid out in dividends rather than reinvested in future capital spending and/or used to repurchase stock.
Figure 4 – For 2026/2027, S&P 500 Earnings Are Expected to Far Outpace Those of Defensive Factors Such as Minimum Volatility (M001MV$T) and High Dividend (MXUSAHDV)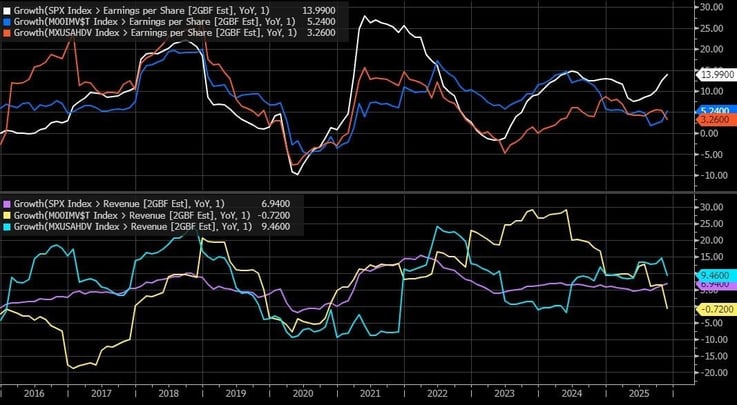
Source: Bloomberg Estimated 24 Months EPS and Revenue Growth for S&P 500, MSCI USA Minimum Volatility, and MSCI USA High Dividend
Defensive sectors/market segments as captured by minimum volatility and high dividend factors, behave more countercyclically as these segments generally grow revenue and earnings at a lower rate than the overall market. Indeed, these factors are overweight the more defensive sectors (healthcare, consumer staples, and utilities) while underweight high growth sectors (technology, communications, and consumer discretionary) (Figure 5a and 5b). The High Dividend factor does have more cyclical exposure versus Minimum Volatility with overweights to industrials and energy, but this is primarily due to index composition capturing mature companies with a long history of dividend payouts.
Figure 5a and 5b – Minimum Volatility (M001MV$T) and High Dividend (MXUSAHDV) Factors Are Overweighted the More Defensive Sectors within the Market
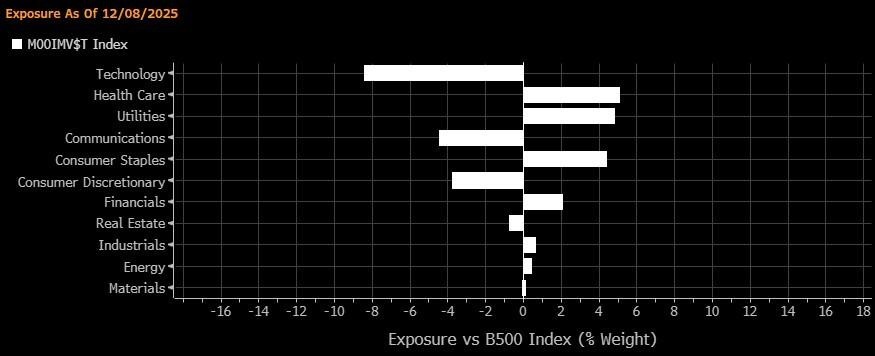
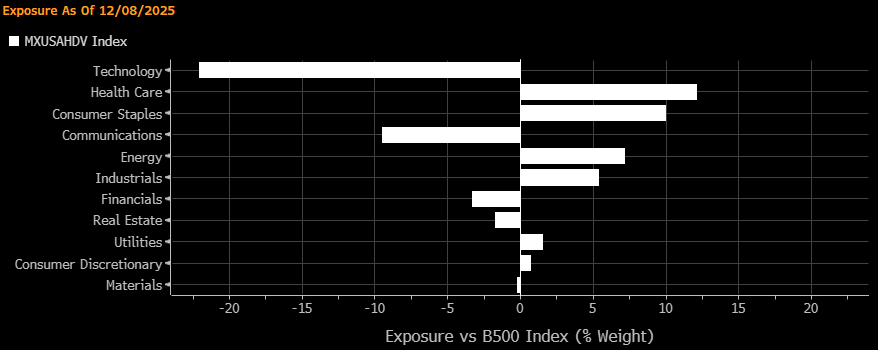
Source: Bloomberg TLTS Sector Relative Sector Weights versus the Bloomberg 500 Index.
Equity markets price in the base case outlook and factor in a level of uncertainty or term premium versus asset classes with fixed cash flows such as bonds and cash. From this pricing, one can tease out implied expectations for future growth prospects and 1) what premium investors are willing to surrender in return for ‘greater certainty’ or 2) demand a higher premium to be compensated for ‘greater uncertainty’.
These implied premiums can be captured through a factor lens by showcasing the relative factor risk exposures a portfolio exhibits versus the broader market. Bloomberg provides such a tool with the TLTS function.
Viewing the Minimum Volatility and High Dividend portfolios through a factor lens (Figure 6a and 6b), we can see that investors are indeed demanding a high premium (Value) in the face of higher fundamental uncertainty as represented by Quality and Growth, as evidenced by the low relative exposures over the trailing 5-year period. Both factors are priced attractively from a valuation and yield standpoint even as the fundamentals look the least attractive relative to the market.
Figure 6a and 6b – Minimum Volatility (M001MV$T) and High Dividend (MXUSAHDV) Factors Are Near Post-COVID Extreme Levels on Valuation, Yield, and Quality, and Growth vs. the Market
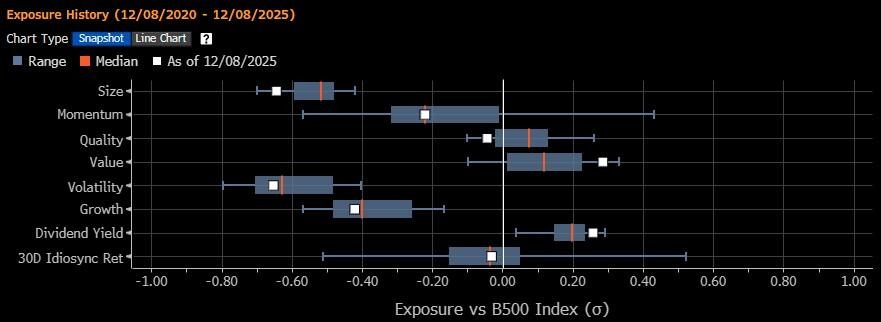
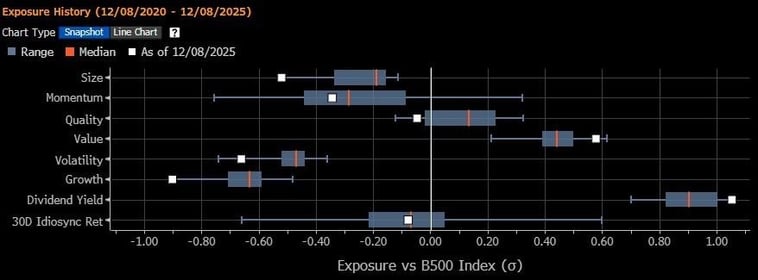
Source: Bloomberg TLTS Factor Exposures (standardized units) versus the Bloomberg 500 Index.
This highlights how extreme sentiment has become on both ends: a very negative outlook toward playing defense and an overly optimistic outlook toward risk-on, procyclical exposures, as reflected in high valuations and low yields.
What to Do
Even though there is accumulating evidence of an economic slowdown, if not an actual contraction, whether slower labor hiring, increased balance sheet stress on lower/middle income consumers, or the cost drag from tariffs, the U.S. economy is still expected to grow ~2% on a real basis in 2026, propelled by stimulus from the One Big Beautiful Bill Act (OBBBA) and spending projections for AI data center buildouts. Additional fuel may be provided by interest rate cuts from the Federal Reserve. Positioning for a base case outcome would entail taking a risk-on, procyclical tilt across asset classes and market segments expected to benefit from these economic tailwinds, even if the risk premiums afforded to investors have narrowed considerably.
As evident by this year’s strong performance in risk-on assets, whether equities, high yield credit, or industrial/precious metals, the benefit of the doubt remains with the base consensus of a positive growth outlook aided by an easier Fed policy. As such, investors are advised to maintain their long-term strategic allocation to risk in accordance with goals and time horizons.
However, we believe we’ve reached a baby-thrown-out-with-the-bathwater moment for going defensive as stocks with low volatility and high dividend characteristics have been cast aside in favor of tech-driven, cyclical growth. Stocks with defensive characteristics may be suffering from fundamental headwinds of lower expected growth and quality, but there could be opportunities to add defensive exposure not experiencing these fundamental headwinds.
This can be achieved either through traditional active management (conservative or value-driven investment philosophies with experience finding diamonds in the rough) or through systematic means via quantitative screening and portfolio optimization. Freedom Investment Management offers the latter in the form of a Separately Managed Account (SMA). The Dividend-Focused Large Cap SMA performs an optimization emphasizing high quality stocks while targeting an overall portfolio yield above that of the broader market. Please contact us if you would like further information.

*Fractional shares are not available at every custodian.